Before analyzing the two SBIRS–HEO images, its necessary to review a little of phenomenology associated with viewing rocket plumes in the infrared. That’s because there are some surprising effects that show up very well in both these photos that, perhaps, most people would not be aware of. In particular, I’m thinking of the “trough” a missile plume appears to go through when it passes through a region roughly 70 to 90 km high. If you look back to the first post I made on these images , you can perhaps see this trough as a dim spot in the plume’s trace as it streaks across the field of view. But I’m getting ahead of myself. Today, we need to discuss both the signal and the predominant background: reflected sunlight.
From the very start of the US space-based, early warning program, our satellites have reduced the background caused by sunlight reflected off of various things (clouds, snowfields, water) by only looking in a very narrow wavelength around 2.7 microns. This is the band at which water both radiates—when it is created in the combustion of hydrocarbons such as kerosene and acids such as nitric acid—and absorbs when it is in a more relaxed state, such as water vapor in the atmosphere.
What the world would look like to SBIRS if there were no atmosphere
If you were to stand 100 meters away from a Titan II missile (sorry, I know that’s rather an obsolete missile, but I happen to have the data for its plume radiance but not for more relevant rockets such as the Delta II) was firing, every thing else would appear dimmer than the plume. That is because sunlight reflected from a square meter is relatively weak as shown in the left side of this picture:
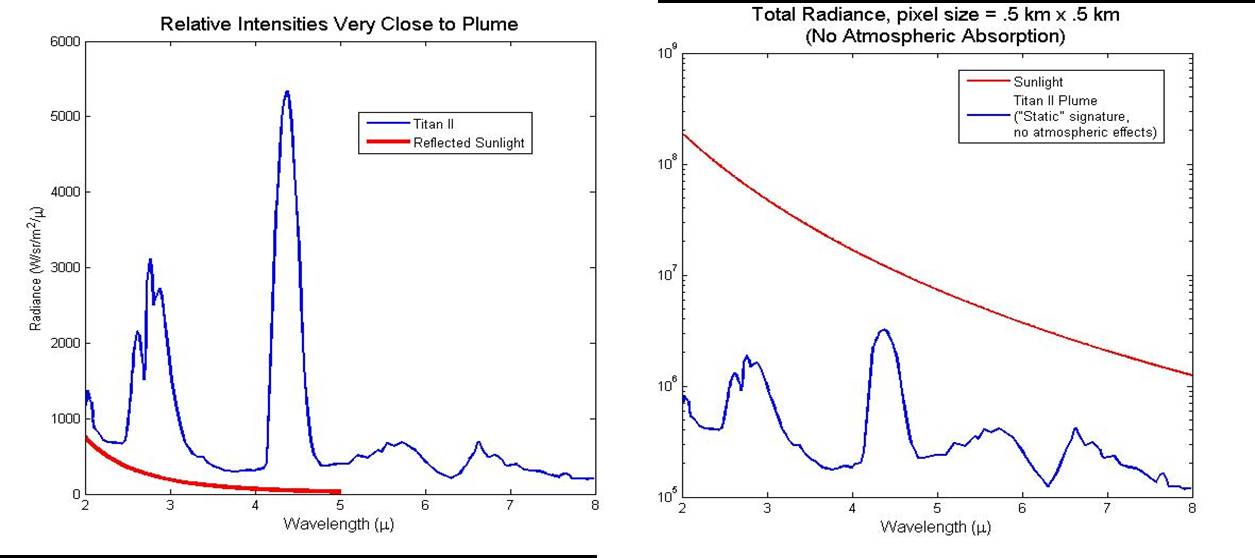
The right side of this picture shows a rather artificial comparison, namely if there were no atmospheric or dynamic effects. Here, a single pixel on the SBIRS sensor is assumed to be 0.5 km x 0.5 km on a side. In that case, you have no choice but to add up (or, as a techno-wonk might say, “integrate”) all the sunlight reflected to SBIRS that landed in that pixel. In this case, the sunlight is assumed to be reflected by something like white sand (white in the infrared(!), whatever color that corresponds to) and is “diffusively” reflected. If the sun, Earth, and satellite are aligned in the proper way, you could get specular reflection, when the Earth acts as a very good mirror, and get a considerable increase in solar power directed into the pixel and further worsening the signal to noise ratio. It doesn’t take ice or snow to give specular reflections, you can see from an airplane that trees, rocks, cornfields, clouds also give specular reflection—only in this case, specular backscatter—if you look at the bright circle around the plane’s shadow.
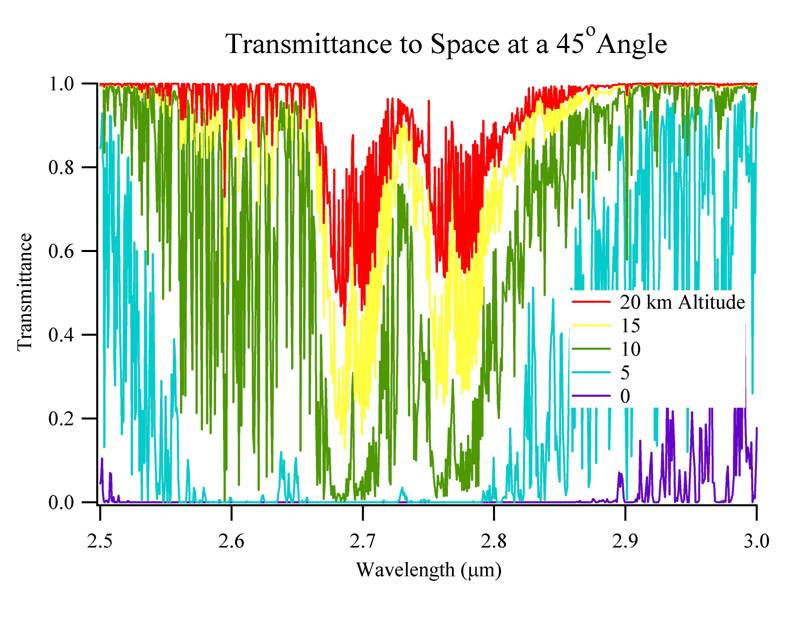
Adding in atmospheric absorption
Most of the sunlight, however, is reflected off of things fairly low in the atmosphere. Even most clouds are, almost by definition, in the “moist” part of the atmosphere where water vapor can absorb the same wavelengths of light that is generated by the water molecules in the rocket exhaust. The graph below shows the one-way absorption of light by the atmosphere for different heights that it originated. Sunlight reflected off of clouds would have to pass twice through this absorption and be even further reduced relative to the signal.
By the way, this atmospheric absorption worked so well and the DoD was so entranced by it that it apparently became very difficult for other sensors, that did not use this this absorption band, to be approved. Lets hope that the few military satellites that have flown with other sensors have convinced the powers-that-be that those wavelengths are valuable too!
Rockets move fast
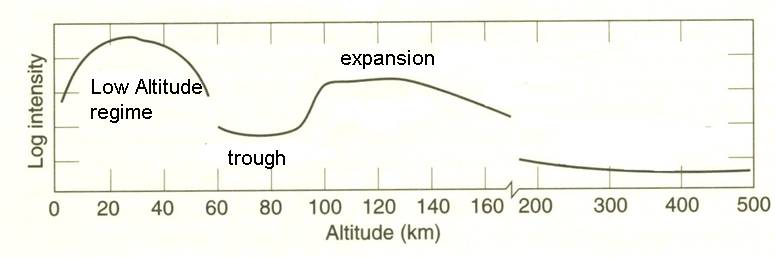
This is not the complete story, however! There are other effects as the rocket moves through the atmosphere that also changes its signal. At low altitudes, there is enough oxygen for unburnt fuel to combust in “afterburning.” This, plus the shear-induced shock wave produced by the exhaust as it hits the atmosphere upon exiting the nozzle, increases the plume temperature and hence the signal at low altitudes. Even the aluminum particles ejected from most solid propellants continue to combust and radiate at these altitudes. These low altitude enhancements reach a maximum at around 20 km and can fall very quickly above that as the atmospheric oxygen drops off.
After the low altitude effects drop off, the plume is said to enter a “trough” region where the overall brightness of the plume drops to very low levels. In addition to a lack of oxygen for afterburning, the rocket is moving so fast that its exhaust gas comes out almost at rest with respect to the atmosphere. This reduces the shear shockwave effect that reheats the exhaust at lower altitudes, causing a further reduction in radiation. The trough occurs roughly between 40 and 90 km. Above this altitude the exhaust brightness increases again: the exhaust first displaces the very thin atmosphere as it comes out at temperatures lower than the ambient temperature. But as the rocket moves away, the atmosphere actually compresses the exhaust plume, creating a new shockwave that can reheat the plume up to temperatures near the combustion chamber temperature. These different regions are shown in the picture below:
Tomorrow, we will use these effects to understand the images taken by SBIRS–HEO 1 and 2. Until then, you might want to play around with the model of the Delta II 7920H that I’ve written to simulate the June 11, 2008 launch that SBIRS–HEO 2 imaged. There are, unfortunately, a number of approximations I’ve had to make to simulate this missile with its very complex flight that has both ground- and air-lit strap on solid-propellant boosters. I’ve included it as the first entry in the comment section. Remember, you can use GUI_missileFlyout to run that model.

Here are the Delta II 7920H model parameters:
<?xml version=“1.0” encoding=“utf-8”?>
<root_element>
<missileName>DELTA II 7920H </missileName>
<missileParameters>3.000000e+000 7.349081e+000 7.349081e+000 4.002625e+000 2.475000e+002 2.660000e+002 2.640000e+002 6.300000e+001 6.300000e+001 1.380000e+002 2.229711e+005 1.365676e+005 1.255422e+005 1.800295e+004 9.001474e+003 1.300727e+004 2.553173e+004 3.306934e+002 0.000000e+000 0.000000e+000 0.000000e+000 1.000000e+009 0.000000e+000 0.000000e+000 0.000000e+000 3.030000e+002 9.000000e+001 2.858208e+001 -8.058302e+001 0.000000e+000 0.000000e+000 0.000000e+000 0.000000e+000 0.000000e+000 0.000000e+000 0.000000e+000 0.000000e+000 0.000000e+000 0.000000e+000 0.000000e+000 3.280840e+000 0.000000e+000 0.000000e+000 0.000000e+000 0.000000e+000 0.000000e+000 0.000000e+000 0.000000e+000 5.741470e+000 0.000000e+000 </missileParameters>
<launchSiteName>Kennedy Space Center USA </launchSiteName>
<launchSiteCoords>-8.058302e+001 2.858208e+001 1.000000e+000 </launchSiteCoords>
<missileAuthors> G. Forden, based on information from Mark Wade’s Encyclopedia Astronautica </missileAuthors>
<article> http://www.astronautix.com/lvs/delta.htm </article>
<journal> </journal>
<description>The Delta II 7920H has 9 GEM 46 solid propellant strap-ons. Six are lit at lift off while the other three are lit in the air, after the first six have burnt out. In order to simulate the rocket, I have had to ignore the time the first six strap-ons remain attached to the rocket after they burnout etc. The three “stages†simulated here are “kludged†together to produce effective first, second, and third stages that correspond to: the time when the core first stage and the first six strap-ons are burning, the time when the remaining three strap-ons and the core first stage are burning, and the time when the core first stage is burning by itself. The effective Isps are determined from the calculated thrusts of combined strap-ons and the core and the dm/dt for the combined system. Unfortunately, the actual second stage cannot be simulated in GUI_missileFlyout because it only simulates a total of three stages, which are taken up by the strap-ons. The pitch program is barrowed from a Soyuz rocket but seems to work well. </description>
<controlFlags>19 1 </controlFlags>
<pitchTime>0.000000e+000 2.029250e+001 2.632541e+001 3.455210e+001 3.948812e+001 4.771481e+001 5.758684e+001 6.581353e+001 7.404022e+001 8.446069e+001 9.104205e+001 9.926874e+001 1.058501e+002 1.118830e+002 1.201097e+002 1.288848e+002 1.338208e+002 1.365631e+002 1.431444e+002 1.908592e+002 2.243144e+002 2.539305e+002 2.819013e+002 2.868373e+002 2.983547e+002 3.082267e+002 3.998172e+002 4.360146e+002 5.374771e+002 </pitchTime>
<pitchAngle>9.000000e+001 9.000000e+001 8.732143e+001 8.428571e+001 8.089286e+001 7.571429e+001 6.928571e+001 6.392857e+001 5.785714e+001 5.250000e+001 4.928571e+001 4.553571e+001 4.285714e+001 4.071429e+001 3.803571e+001 3.589286e+001 3.392857e+001 3.071429e+001 2.982143e+001 2.357143e+001 1.982143e+001 1.589286e+001 1.250000e+001 1.214286e+001 1.178571e+001 1.410714e+001 4.642857e+000 5.357143e-001 -1.071429e+001 </pitchAngle>
</root_element>
Geoff,
it would interesting to try to reverse engineer some of the detector parameters given the image and the altitude of the spacecraft, telescope etc. You mention an assumed pixel footprint of 0.5km by 0.5km — this, if true, would make it similar to MSX . Are these types of parameters known for SBIRS? What can be deduced from the released images?
There is a good overview of the limiting factors in IR clutter analysis at the Aerospace site
Yousaf- I suspect, though I don’t know for certain, that the image has been “pixelated” to mask the true capabilities. You have hit upon the reason I picked 0.5km by 0.5km in the illustration. Thanks for linking to the Aerospace site, I was not aware of that and it looks pretty good.