

A friend sent along an article in Newsweek, Pakistan’s Nuclear Surge, by Andrew Bast that has what I think has to be the worst chart ever.
I mean that.
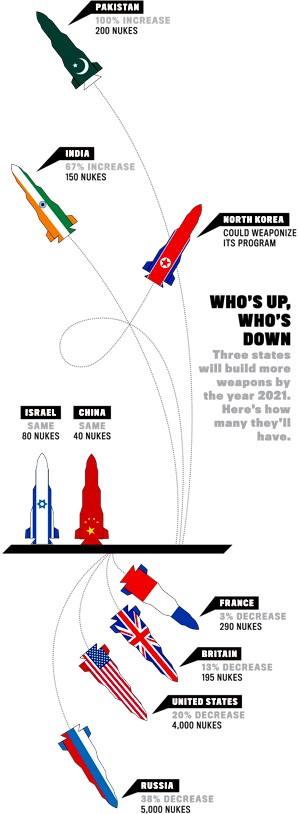
Does this make any sense to anyone?
I see the chart was “Compiled with Hans Kristensen of the Federation of American Scientists” but I don’t think we can blame Hans for this atrocity.
China at 40 nuclear weapons?
North Korea “could” weaponize its program?
This is supposed to be by 2021?
It looks like an Alexander Calder mobile gone terribly wrong.
What are the baseline numbers?
This makes my eyes hurt.