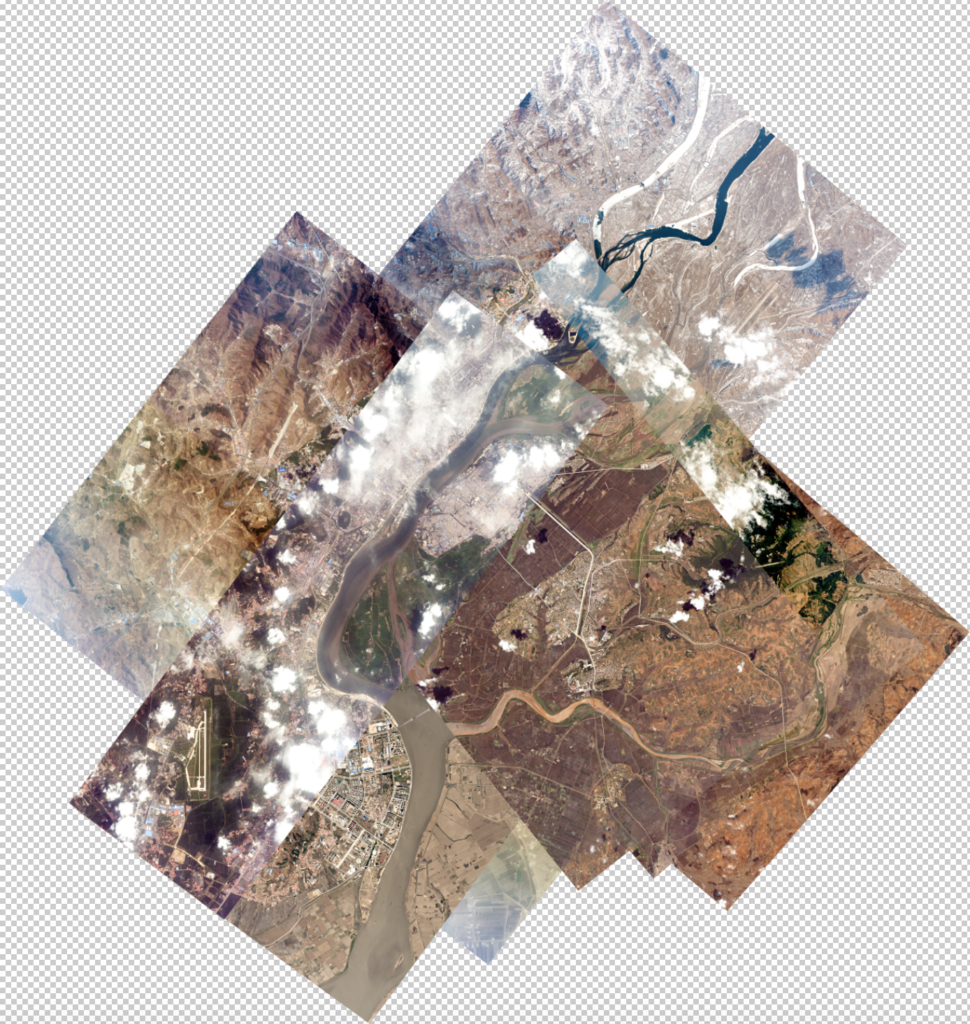
A collection of Planet images of Dandong and Sinuiju from February through July. Images ©2016 Planet Labs, Inc. cc-by-sa 4.0
A few weeks ago, some colleagues new to satellite imagery analysis claimed that China had drastically reduced trade with North Korea to punish Pyongyang for its most recent nuclear test. They made this judgment on the basis of a small number of satellite images of the customs area in Dandong, China and one image of the customs area across the river in Sinuiju, North Korea.
Small samples can be problematic. All sorts of things can go wrong — this is one crossing point, on one day, showing one mode of transport. Some days are busier than others. What if the picture is from a weekend? Or a holiday? In this case, it turned out to be both — the “after” pictures were from February 13-14, the Saturday and Sunday at the end of the Chinese New Year.
Measuring something like trade by monitoring traffic flows is tricky. It requires lots of images. One has to consider the modes of transport for various goods, the entry points, and seasonal variations in trade. And weekends and holidays.
In other words, the correct tool for the job is not a small number of high-resolution images, but a larger number of moderate resolution images from a company like Planet Labs.
As a researcher, I have access to Planet imagery for the purpose of providing expert analysis. I did a review of the border imagery and shared it with Planet. Paul Boutin then turned into a story on their Medium channel, replete with commentary from Steph Haggard and Andrea Berger. The picture at the top of the post is a screen shot of all the images stacked on top of one another.
Although these 2-4 meter images aren’t quite good enough for vehicle counts, you can definitely see whether the customs areas are busy or not. I am agnostic about whether trade is up or down, but the satellite images are not consistent with the idea that China is inflicting much pain on North Korea.
I don’t have much more to add. Paul did a great job writing it up. The one thing I do want to share is a note on method. Paul mentions that I looked at ten good satellite images from February through July. Here is my list of the images and my assessment of whether the lots in Dandong and Sinuiju looked busy or slow. Busy means they looked more like the Digital Globe images from January 15 and March 13, 2015; slow means they looked more like the Digital Globe images from February 13-14, 2016.
There were one or two judgment calls, but with the Scene ID and a Planet account, you can replicate my analysis. There are so many pictures, though, that I think the result is pretty robust — which is the value of having lots of good pictures instead of one great one.
| Date | CST | GSD | Dandong | Sinuiju | Scene ID |
|---|---|---|---|---|---|
| Tuesday, July 12 | 9:08 am | 3.1 | busy | busy | 20160712_010908_0c78 |
| Sunday, June 12 | 12:56 pm | 2.6 | slow | slow | 20160612_045632_0c47 |
| Wednesday, June 8 | 2:45 pm | 2.7 | busy | busy | 20160608_064512_0c64 |
| Thursday, April 28 | 1:54 pm | 2.7 | busy | busy | 20160428_055418_0c47 |
| Wednesday, April 27 | 7:23 am | 2.7 | busy | 20160426_232318_0b0a | |
| Friday, April 22 | 3:20 pm | 2.4 | busy | busy | 20160422_072033_0c03 |
| Tuesday, April 19 | 11:10 am | 2.7 | busy | busy | 20160419_031057_0c66 |
| Monday, April 4 | 10:31 am | 4.1 | busy | slow | 20160404_023119_090c |
| Sunday, February 28 | 2:23 pm | 2.9 | busy | slow | 20160228_062312_0c68 |
| Friday, February 19 | 10:41 am | 2.4 | slow | 20160220_024128_0b0d |

I did a quick bit of Bayesian estimation using your table. The short answer is that the data is utterly inconclusive, so you’re right to be skeptical of your colleague’s conclusions.
In detail, suppose there are two possible models for checkpoint busy-ness. In the first model, the probability of seeing a busy checkpoint in 2015 is the same as the probability of seeing a busy checkpoint in 2016. In the second model, the 2015 probability might be different to the 2016 probability. By making a few (fairly weak) assumptions, we can calculate the probability of these two models. The code is here:
https://gist.github.com/andyljones/8fcf36bcdd3140079e41a514a41c387f
and the answer is that the ‘same’ model has a 60% probability and the ‘different’ model a 40% probability. Going by a standard Bayes factor table, this level of evidence counts as ‘not even worth mentioning’!
For the 2016 dates, the Dandong, China port is busy on all 7 of 7 weekdays and 1 of 2 Sundays. The Sinuiju, North Korea port is busy on 5 of 7 weekdays and 0 of 2 Sundays.
Even if the difference were statistically significant (it’s not), it would only show that China’s port is busier than North Korea’s port. Everyone already knows China is a prosperous country with multiple trading partners. North Korea is an isolated country with few trading partners.
This isn’t a comparison of ports going to third countries. This a land-crossing over a bridge. In other words, the goods are all going between China and North Korea. I simply broke them down by crossing to show variation.
Hmmm. If the two ports only trade with each other over the same bridge, then each pair of ports on the same day is a single observation. If we throw out the Sunday/holiday observations as irrelevant, we have 8 weekdays in 2016: 6 busy, 1 half-busy, and 1 slow. This comes out as “busy” on 6.5 of 8 weekdays (81 percent). We have only one observation in 2015 (“busy”). Definitely not enough observations to establish “less busy” in 2016.
Even if we could establish “less busy” in 2016, there are various hypothesis that could explain “less busy”: North Korea has less money to spend, or not spending its money on imports from China, or trading through alternate ports, or China enforcing official U.N. sanctions. China secretly “punishing” North Korea (in addition to U.N. sanctions) is not the most plausible of these hypotheses, absent further evidence that goes beyond mere trade volume.
As a former DIA/CIA imagery analyst, I agree with Jeffrey et. al.’s analysis and the danger of presuming a trend based on one (or a few) photographs. In some cases, it is possible, e.g. did country X develop/acquire a new weapons system — one photo can be very revealing. But economic analysis takes many images and even then may not indicate single-factor causality.
Another problem with extrapolating with February images is, as Jeffrey points out, the Chinese holiday. The same trend can be seen with Chinese non-delivery of oil in February which is often mis-interpreted as reflecting Beijing sending a signal to Pyongyang over various provocations.
China did not export any crude oil to North Korea in February 2011, February 2012, and February 2013. However, China often does not ship oil to North Korea in February because of seasonal factors. Since 2000, China only shipped crude to North Korea in February during 2001, 2004, 2009, and 2010. Annual Chinese shipments to North Korea in March are often double the usual amount, indicating the reason is not because of Chinese displeasure with nuclear or missile tests.